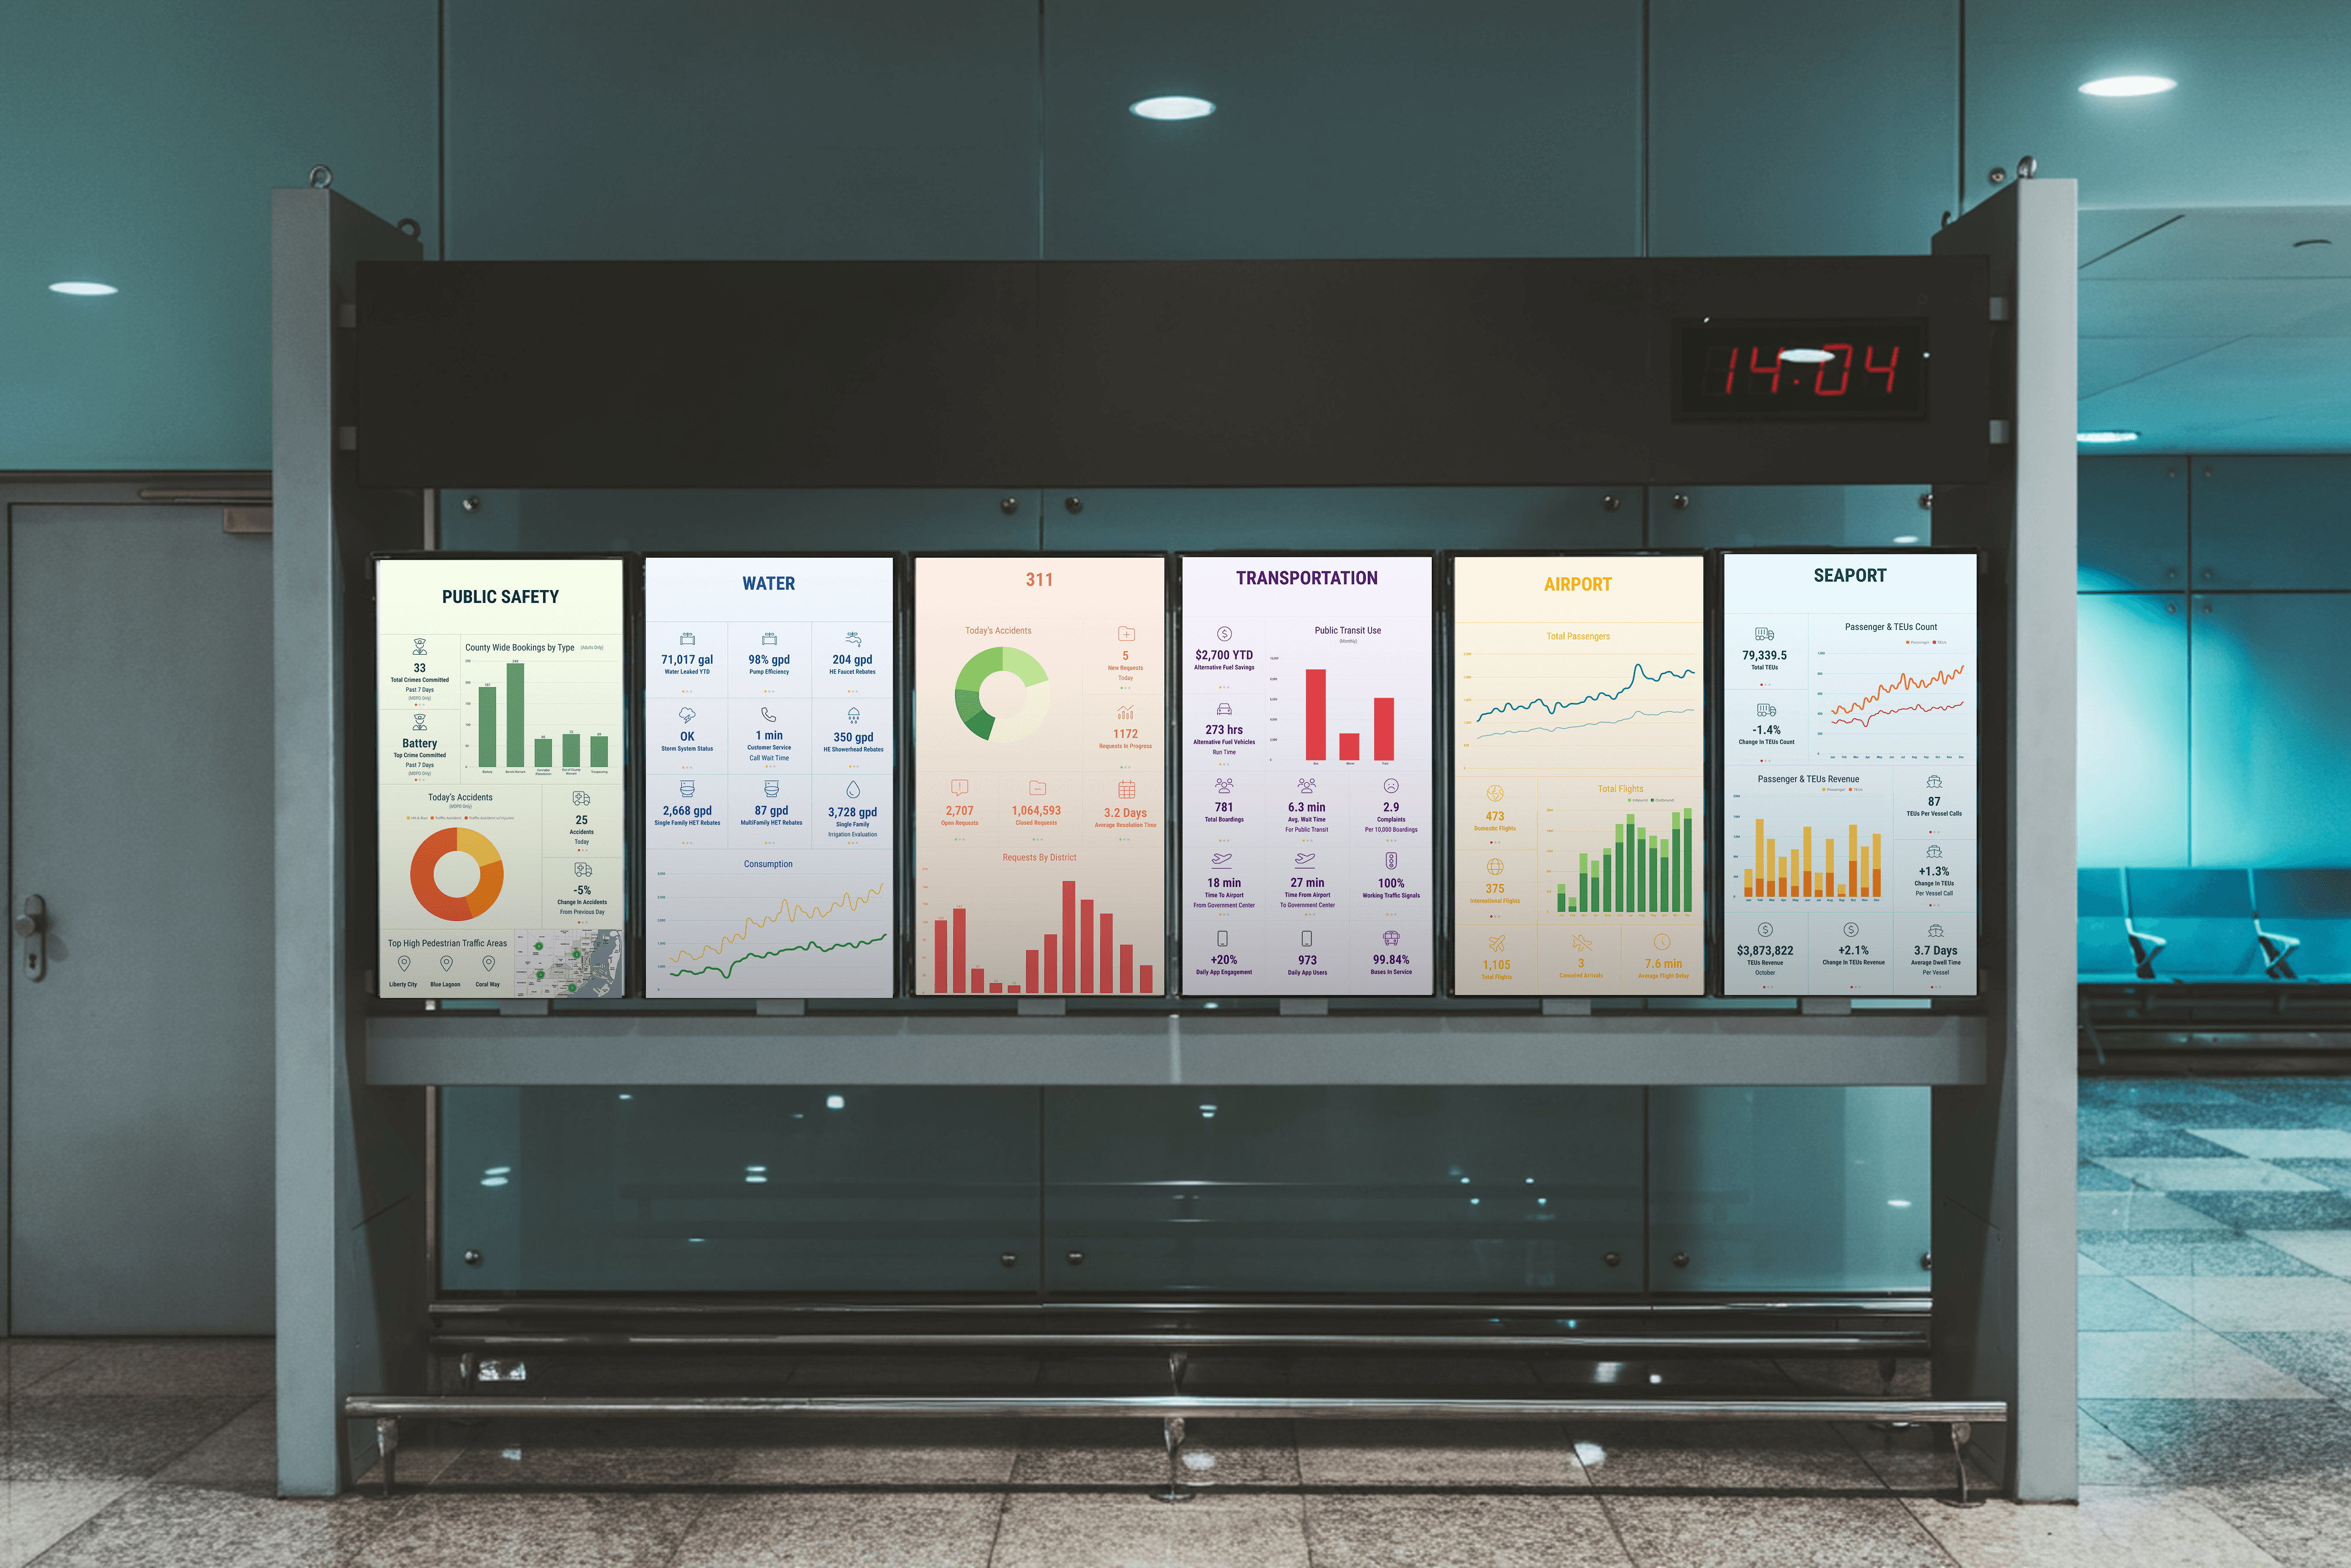
AT&T Smart City Operations Center
Company
AT&T
Industry
Technology & Innovation
Role
Principal Product Designer
Duration
6 Weeks
Who We Designed For
Job To Be Done

The Challenge

The Solution

UX Enhancements
Before | After |
|---|---|
5+ siloed tools per department | One central platform with modular data cards |
Confusing or static reports | Real-time, live data with alerts |
No easy view of cross-departmental events | Unified map with incident layers |
Manual updates for public safety events | Automated feeds with trigger logic |
Little to no accessibility for non-tech users | Role-based dashboards with intuitive UI |

Business Impact
Results
Reduced emergency response times by centralizing alerts and real-time conditions
Improved communication between public safety, transit, and utilities
Minimized service downtime through faster deployment of resources
Simplified system management for civic IT and field operations
Laid the groundwork for future smart city rollouts in other metro areas
“This is the first time we’ve had a clear view of how our city operates—on one screen.” — Miami-Dade Public Safety Officer

My Role
Product Design Lead
UX Strategy · Civic Innovation
Worked closely with civic leaders to identify data gaps and department needs
Led dashboard wireframing, interaction design, and component libraries in Figma
Designed scalable modules to support expanding data inputs
Facilitated working sessions with engineers and external IoT providers
Created prototypes for usability testing with internal and public-sector stakeholders
Tools: Figma · Miro · Slack · Whiteboarding Workshops
Reflection
Designing for city infrastructure meant building for longevity, clarity, and crisis. The project challenged us to think about cross-functional UX from both a data and human standpoint.
If continuing today, I would explore:
Embedded tooltips and explainers for public and technical audiences
Scenario-based simulation tools for city planners
Integration of public-facing dashboards to promote transparency